
Resources Monitoring Tutorial
For almost every type of resource in the application, a separate page for monitoring the main indicators for the selected resource is available.
All data can be exported to any external resource monitoring console, particularly from the most popular ones:
Grafana;
Zabbix.
For this purpose, direct access to the API of the Central Solution Server is used.
The main elements of interaction and view management within the application are described below
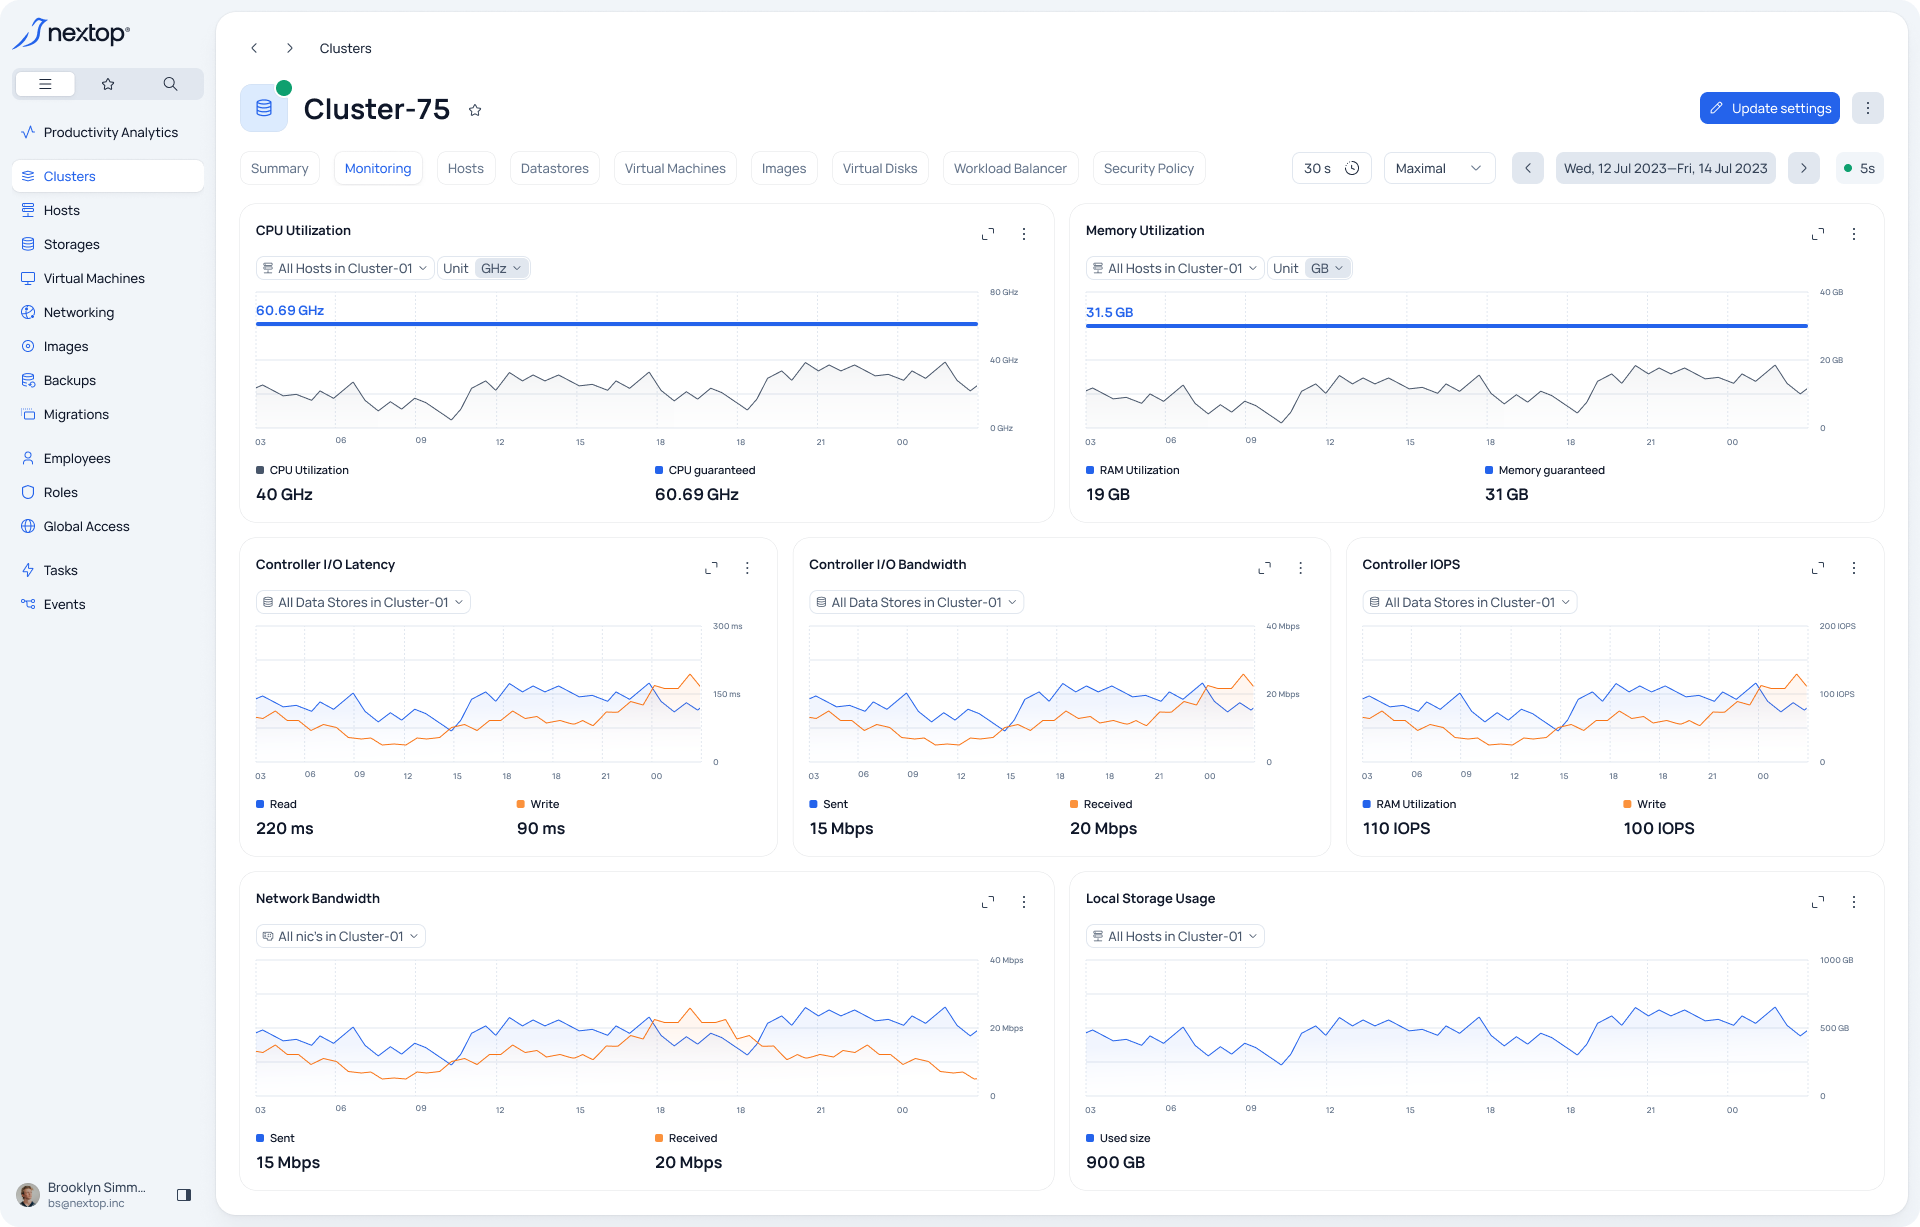
General settings
These include:
Graph point rendering permissions by selected period
Graph aggregation view
Time period selection
Graphics update period
Graph points rendering permissions by selected period
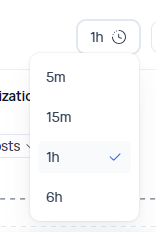
Display example
Dynamically changing list from 30 seconds to 1 day depending on the size of the selected time interval.
Affects smoothing of average values in charts when displayed, for example:
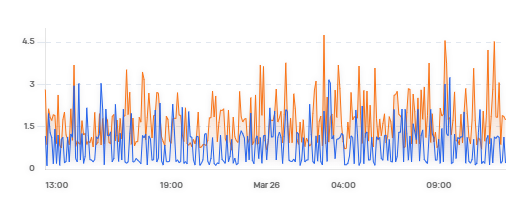 Set interval 1 day, rendering 5 minutes | 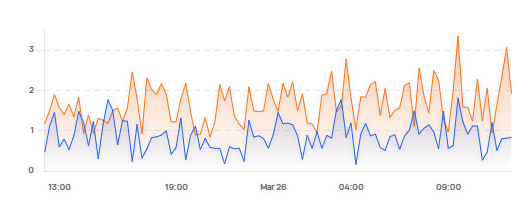 Set interval 1 day, rendering 15 minutes |
|---|
Graph Aggregation View
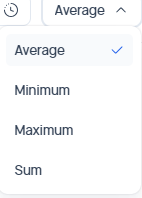
4 modes are available:
Average value
Minimum values
Maximum values
Sum of values
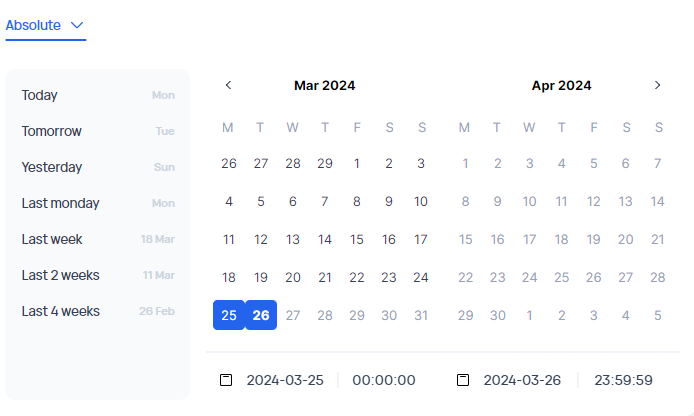
Selecting the time period
Selects the period of data viewing. There are 2 modes available:
Relative
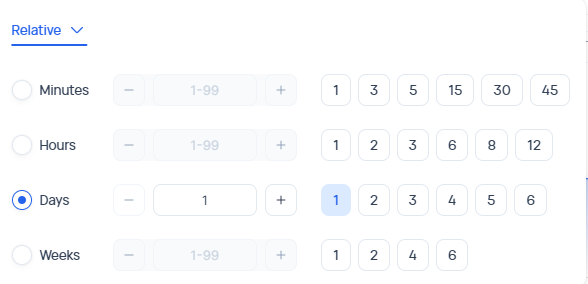
Absolute
Graphs update period
With what frequency the data is updated during online monitoring. The only period available by default is 30 seconds.
Specific chart settings
The following elements are available within the scope of working with a chart:
Selection of a separate entity to filter data (for example, a specific server within a cluster)
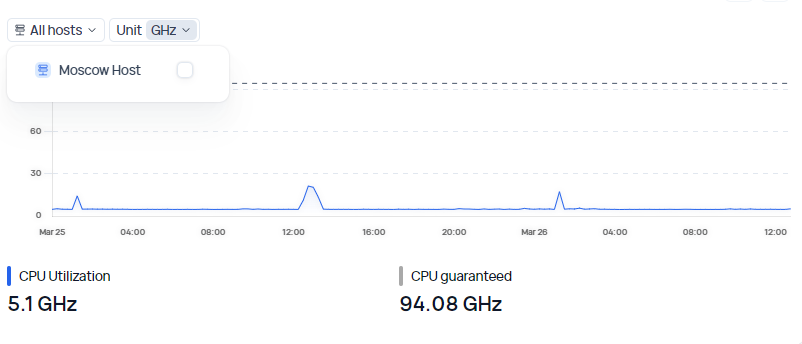
Selecting a unit of measurement
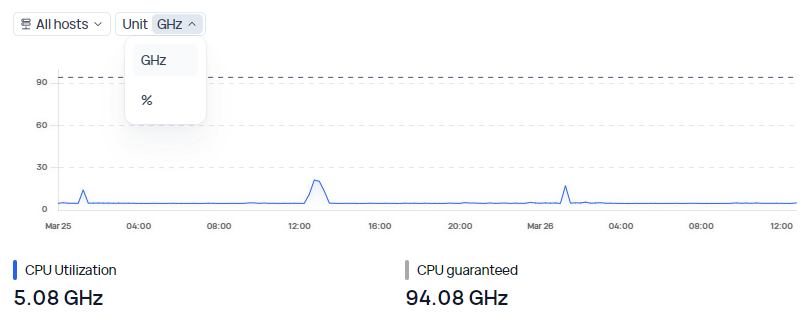
These settings apply only to the selected graph and do not affect the others in the view.