
System tasks and Event logs
Components represent a log of all events occurring in the system sorted by creation time. Logging is performed at the level of two entities - Task and Events generated by the execution of this task.
Inside the task, by the status and technical output you can understand the success of the operation and what influenced the incorrect completion of the operation.
Possible statuses with their description:
Success - The task was successfully completed
Pending - The task could not be created due to an internal error. In case of recurrence it is required to contact the solution provider
Queued - the task is in the queue. The situation can occur when there is a heavy load, as well as when tasks are executed sequentially, they will be waiting in the queue.
Running - the task is running
Deferred - the task has been deferred and is waiting for a trigger to start. For example, changing a VM's allocated resources will wait for it to stop for application.
Rejected - the task has failed verification and has been rejected. Typical errors for this status are described in the "Errors" paragraph below
Error - the task was not executed or completed with an error. Typical errors for this status are described in the "Errors" item below
Task log
All controls and data are located in the "Tasks" tab of the navigation menu.
The main screen includes a tabular representation of the entire list of tasks created in the system.
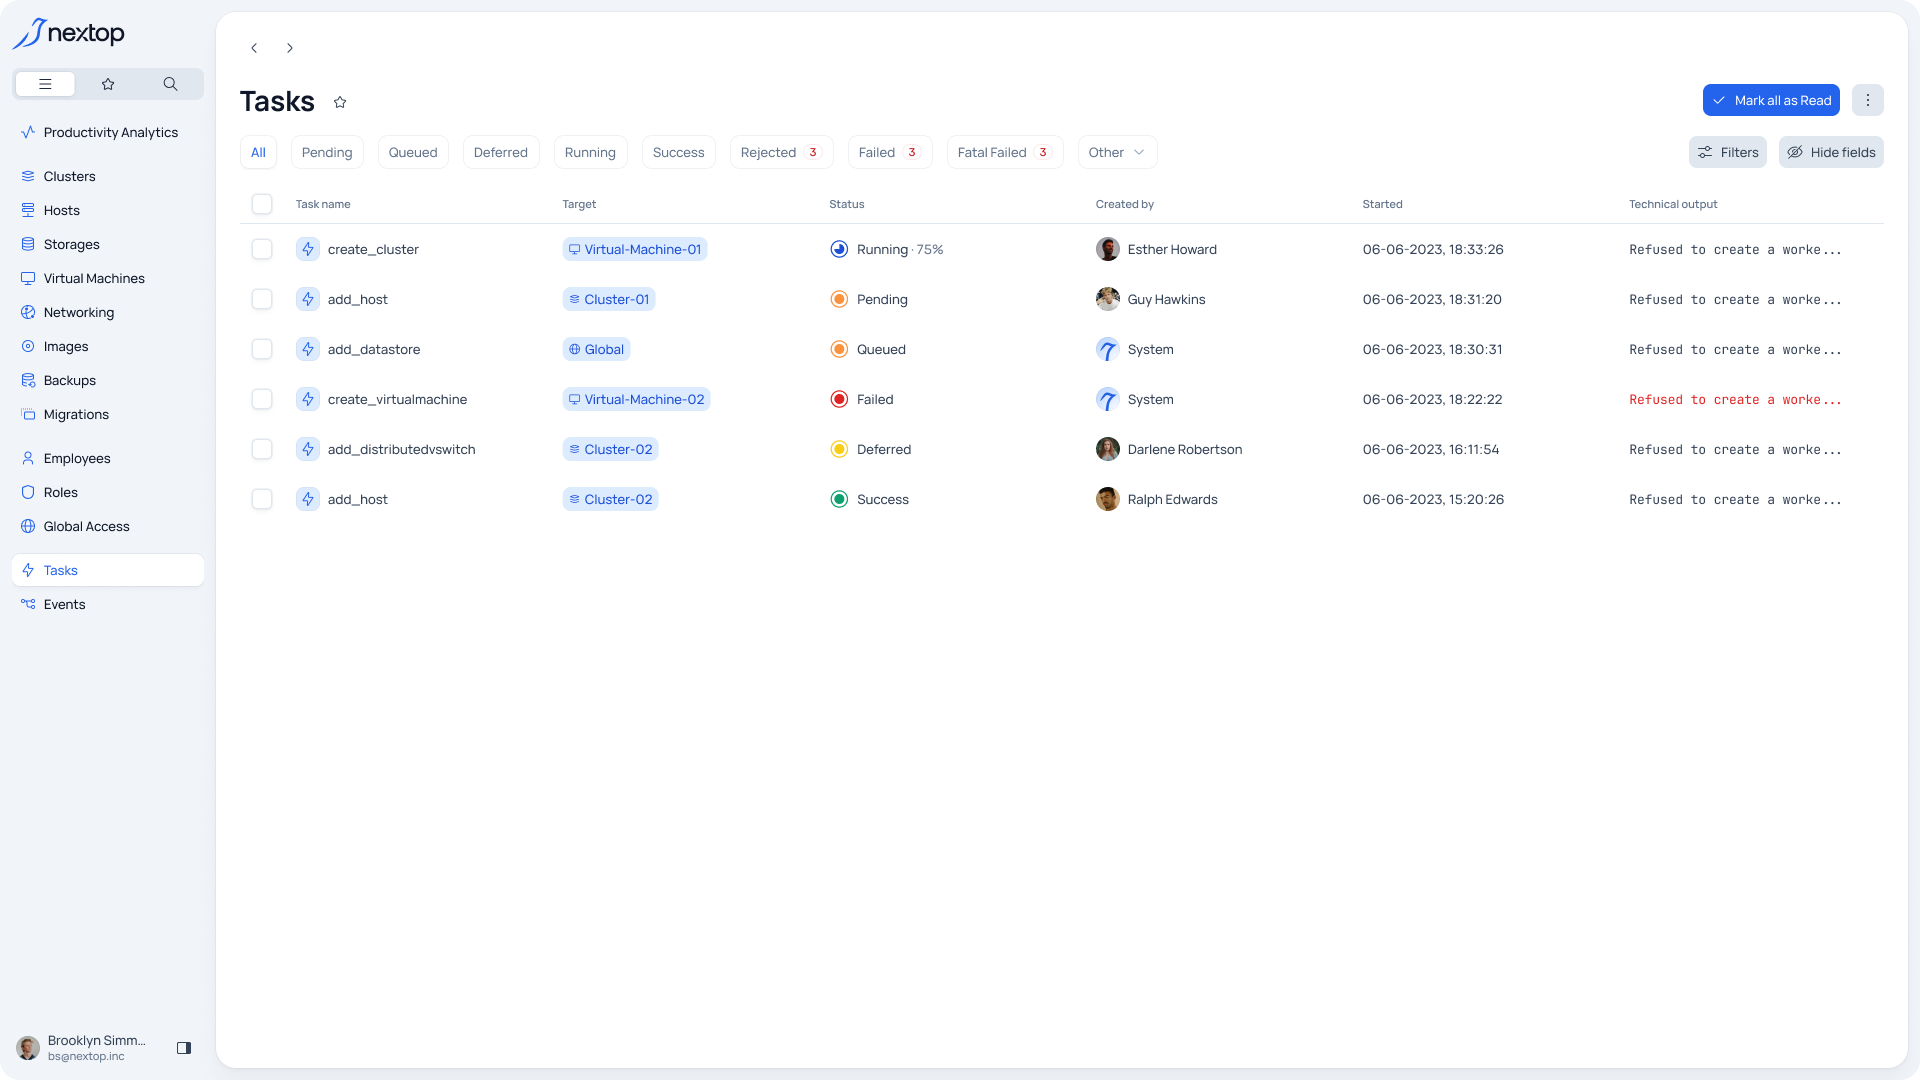
For ease of use, you can filter tasks by their execution statuses using the tabs in the application header.
For detailed information on a task, you should select the necessary one in the list and press on it.
Inside you can find information by
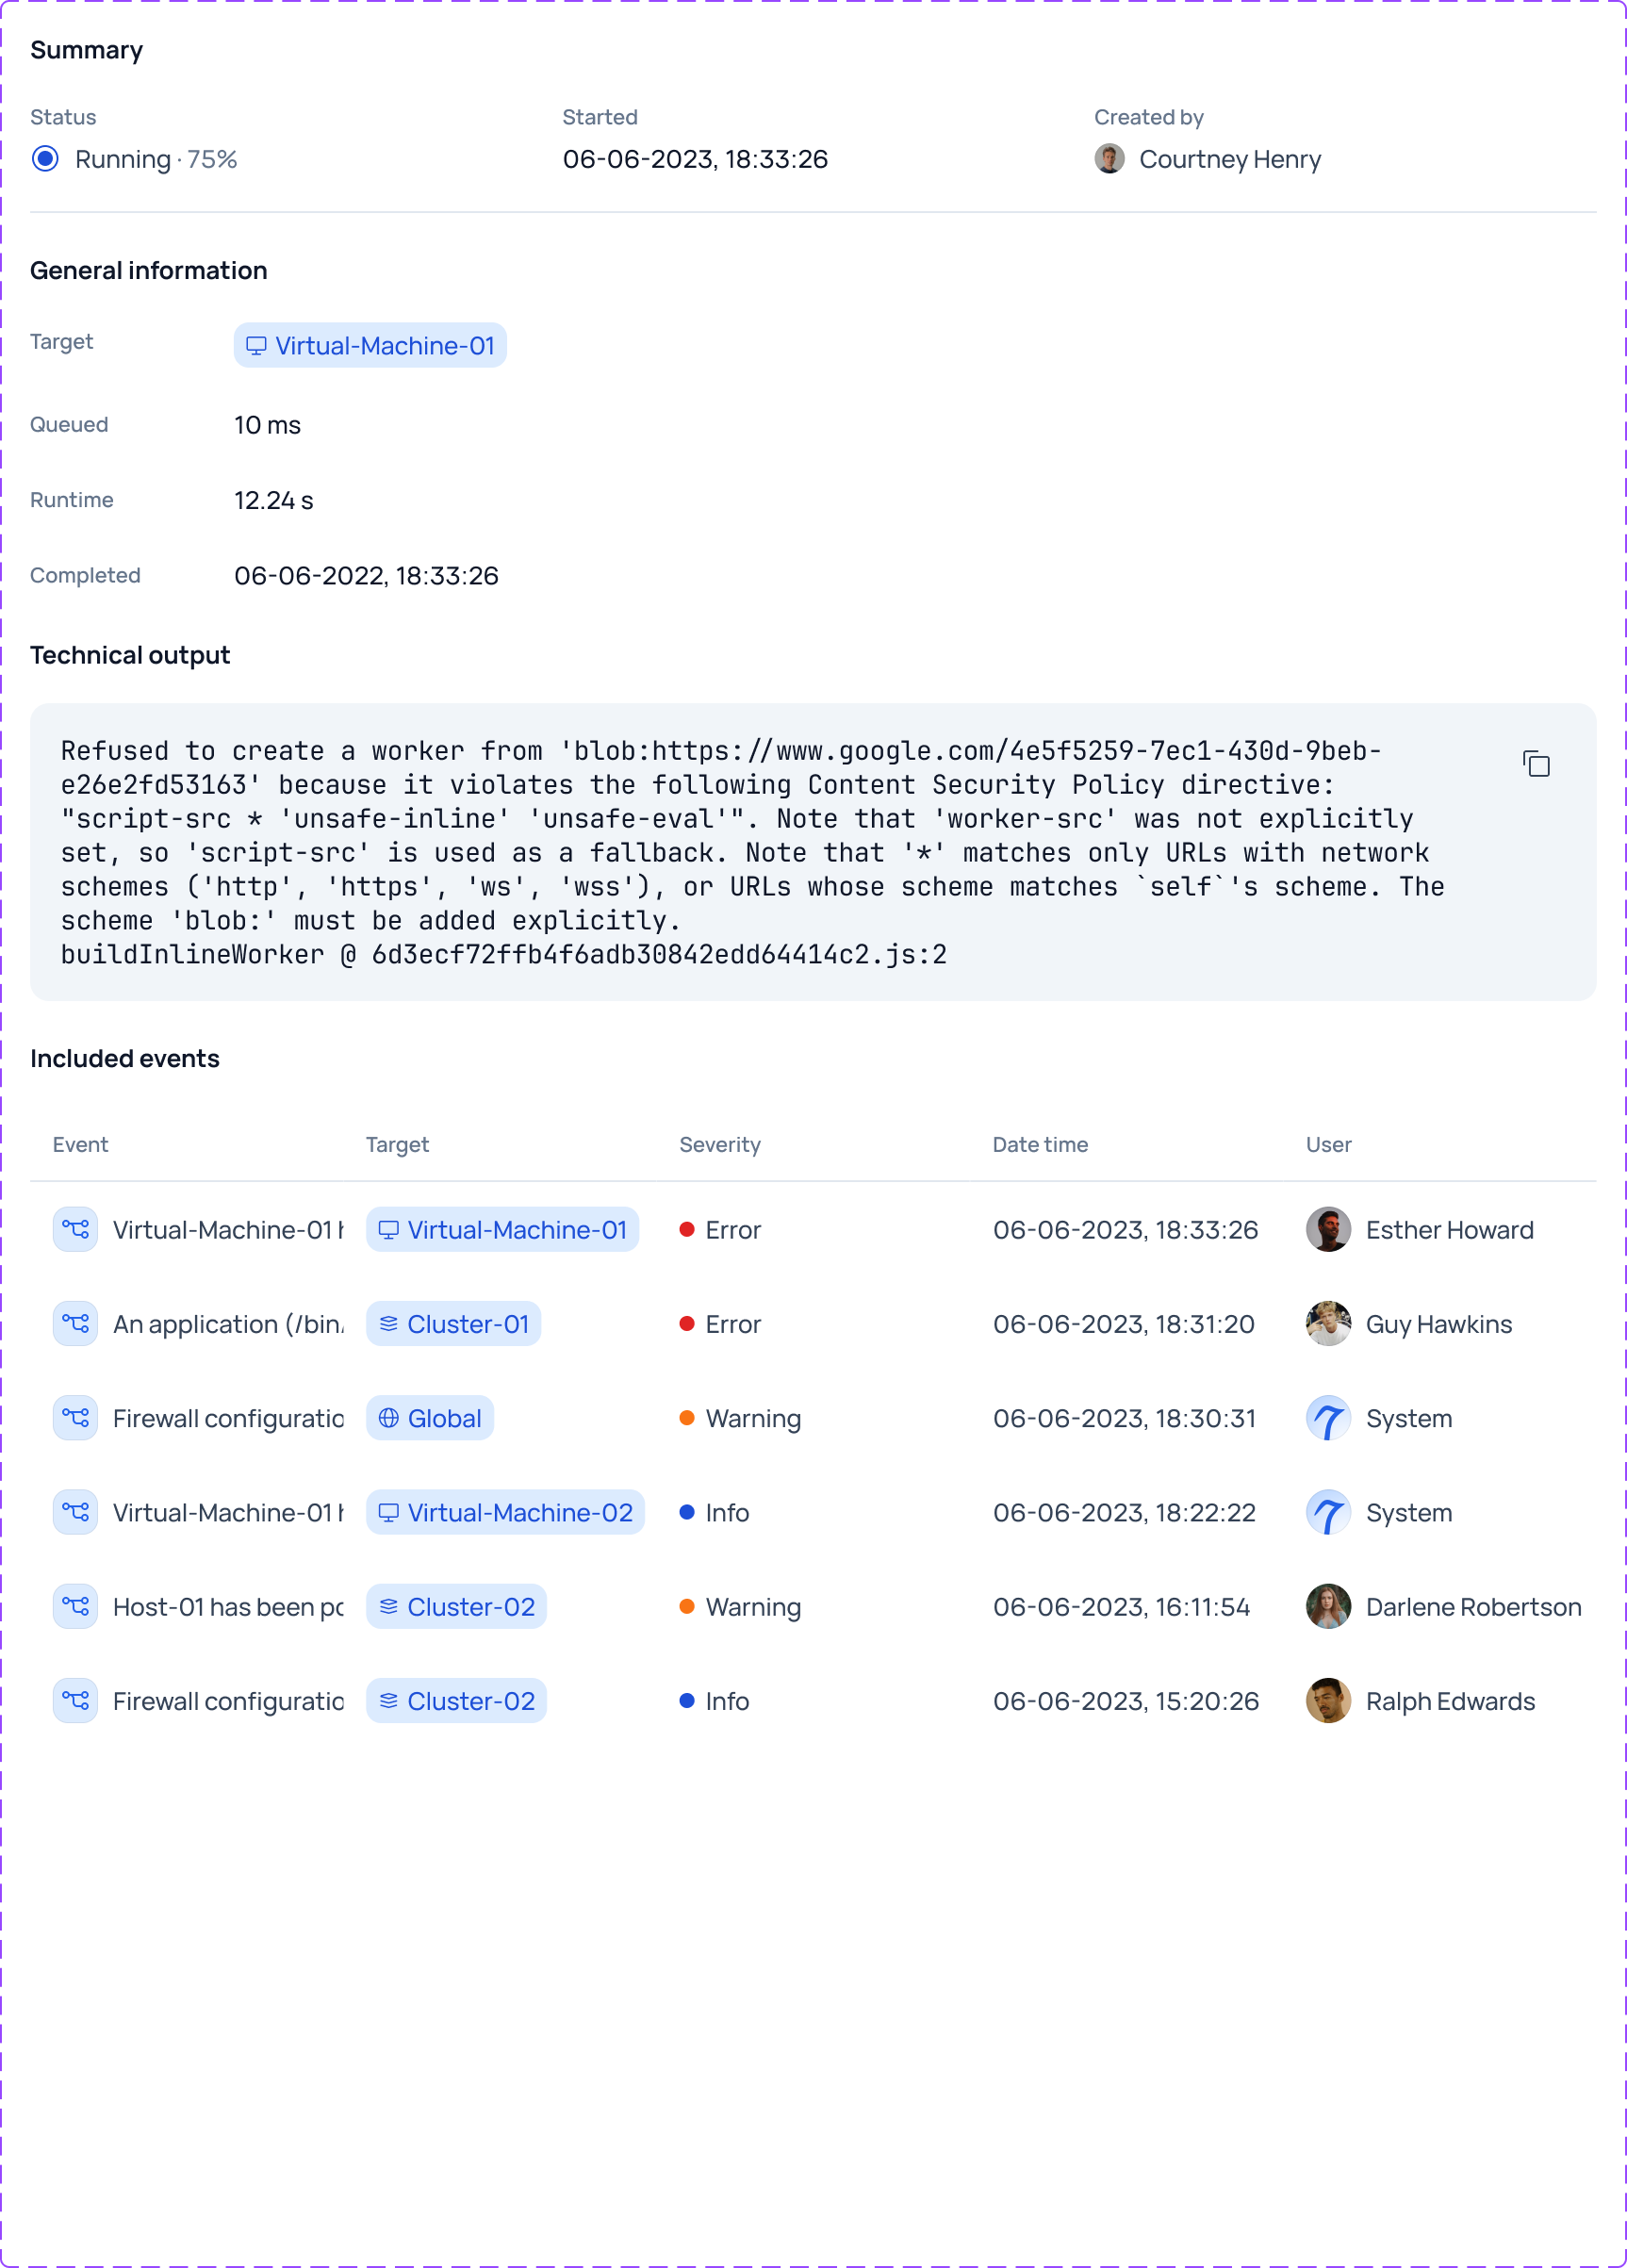
Status
Date and time of creation/completion
Creator
Task Purpose
Time in queue
Execution time
Technical output (if any)
List of events within the selected task
Event log
Identical component to the task log described above. All controls and data are located in the "Events" tab of the navigation menu. The main screen includes a tabular view of all events generated by tasks.
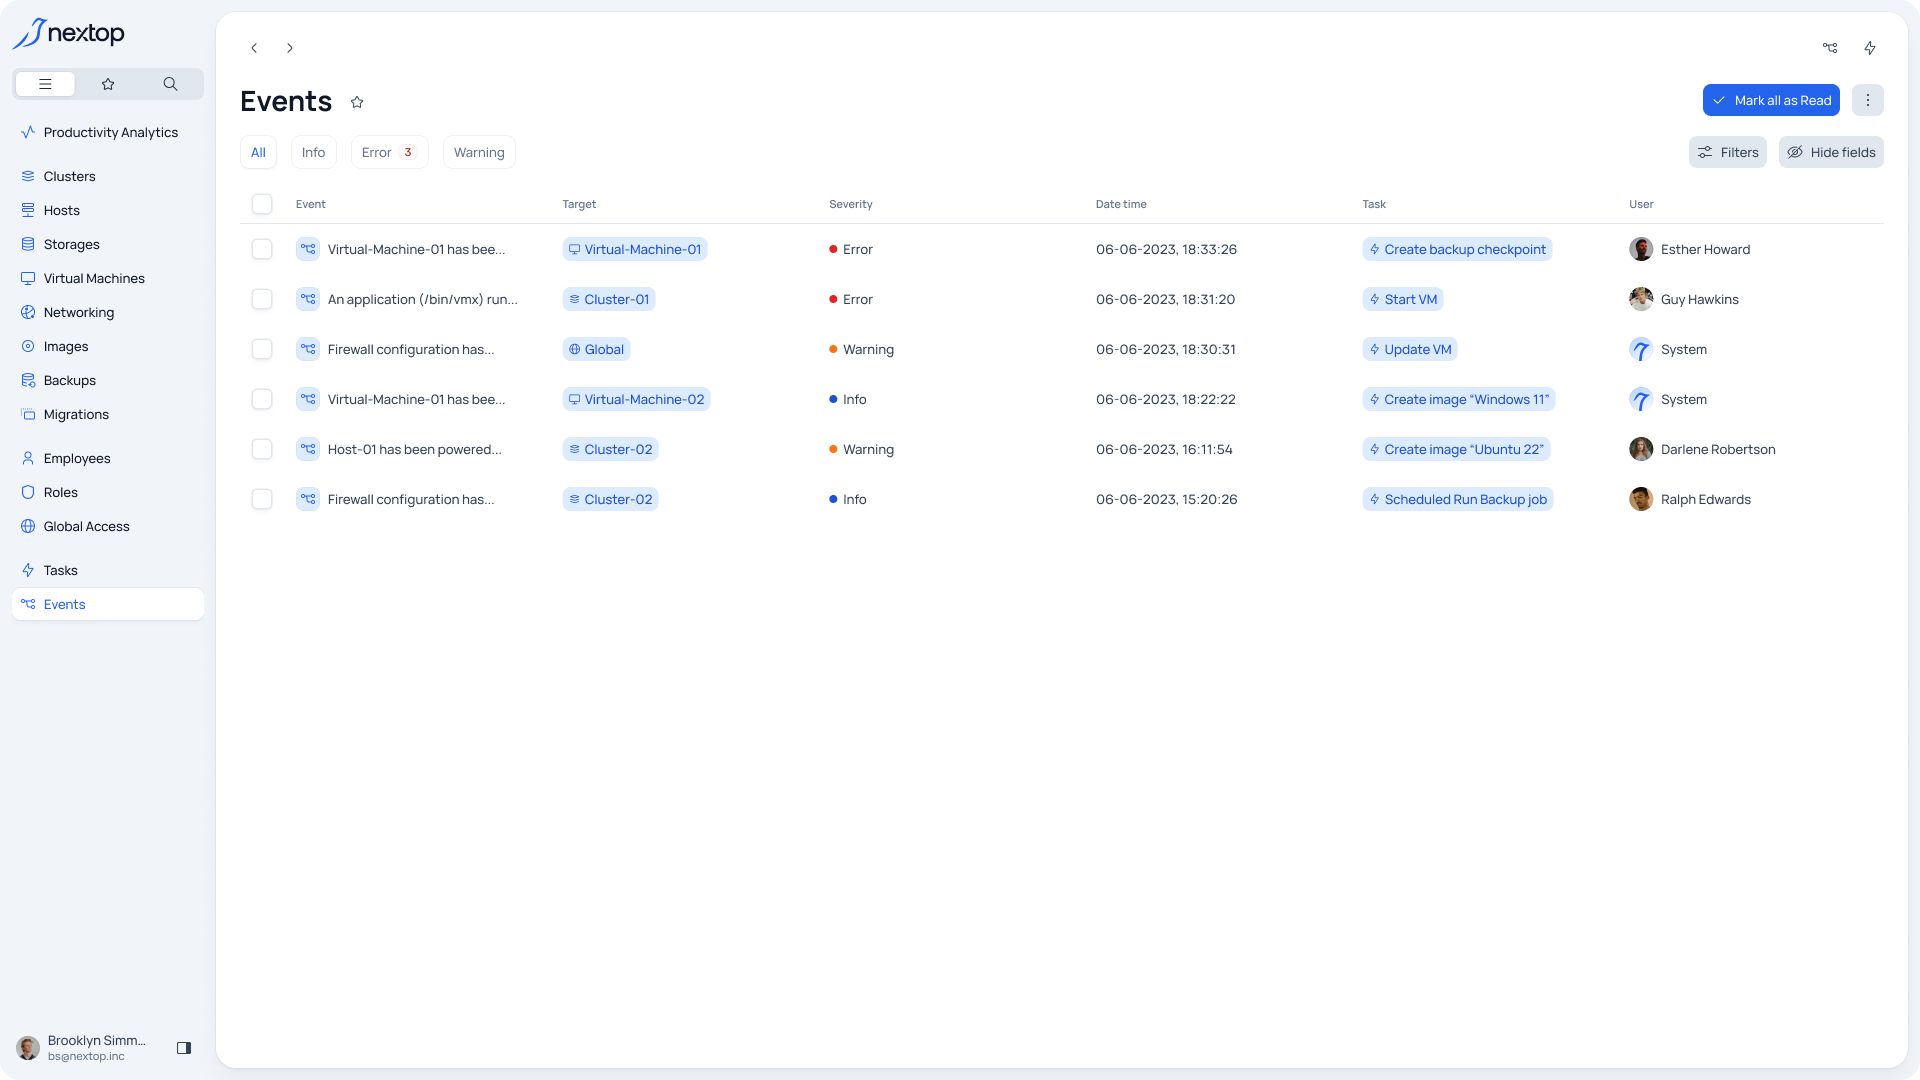
Filtering by event type is available.
For detailed information, you need to select the desired event in the list and click on it.
Inside, information is available by:
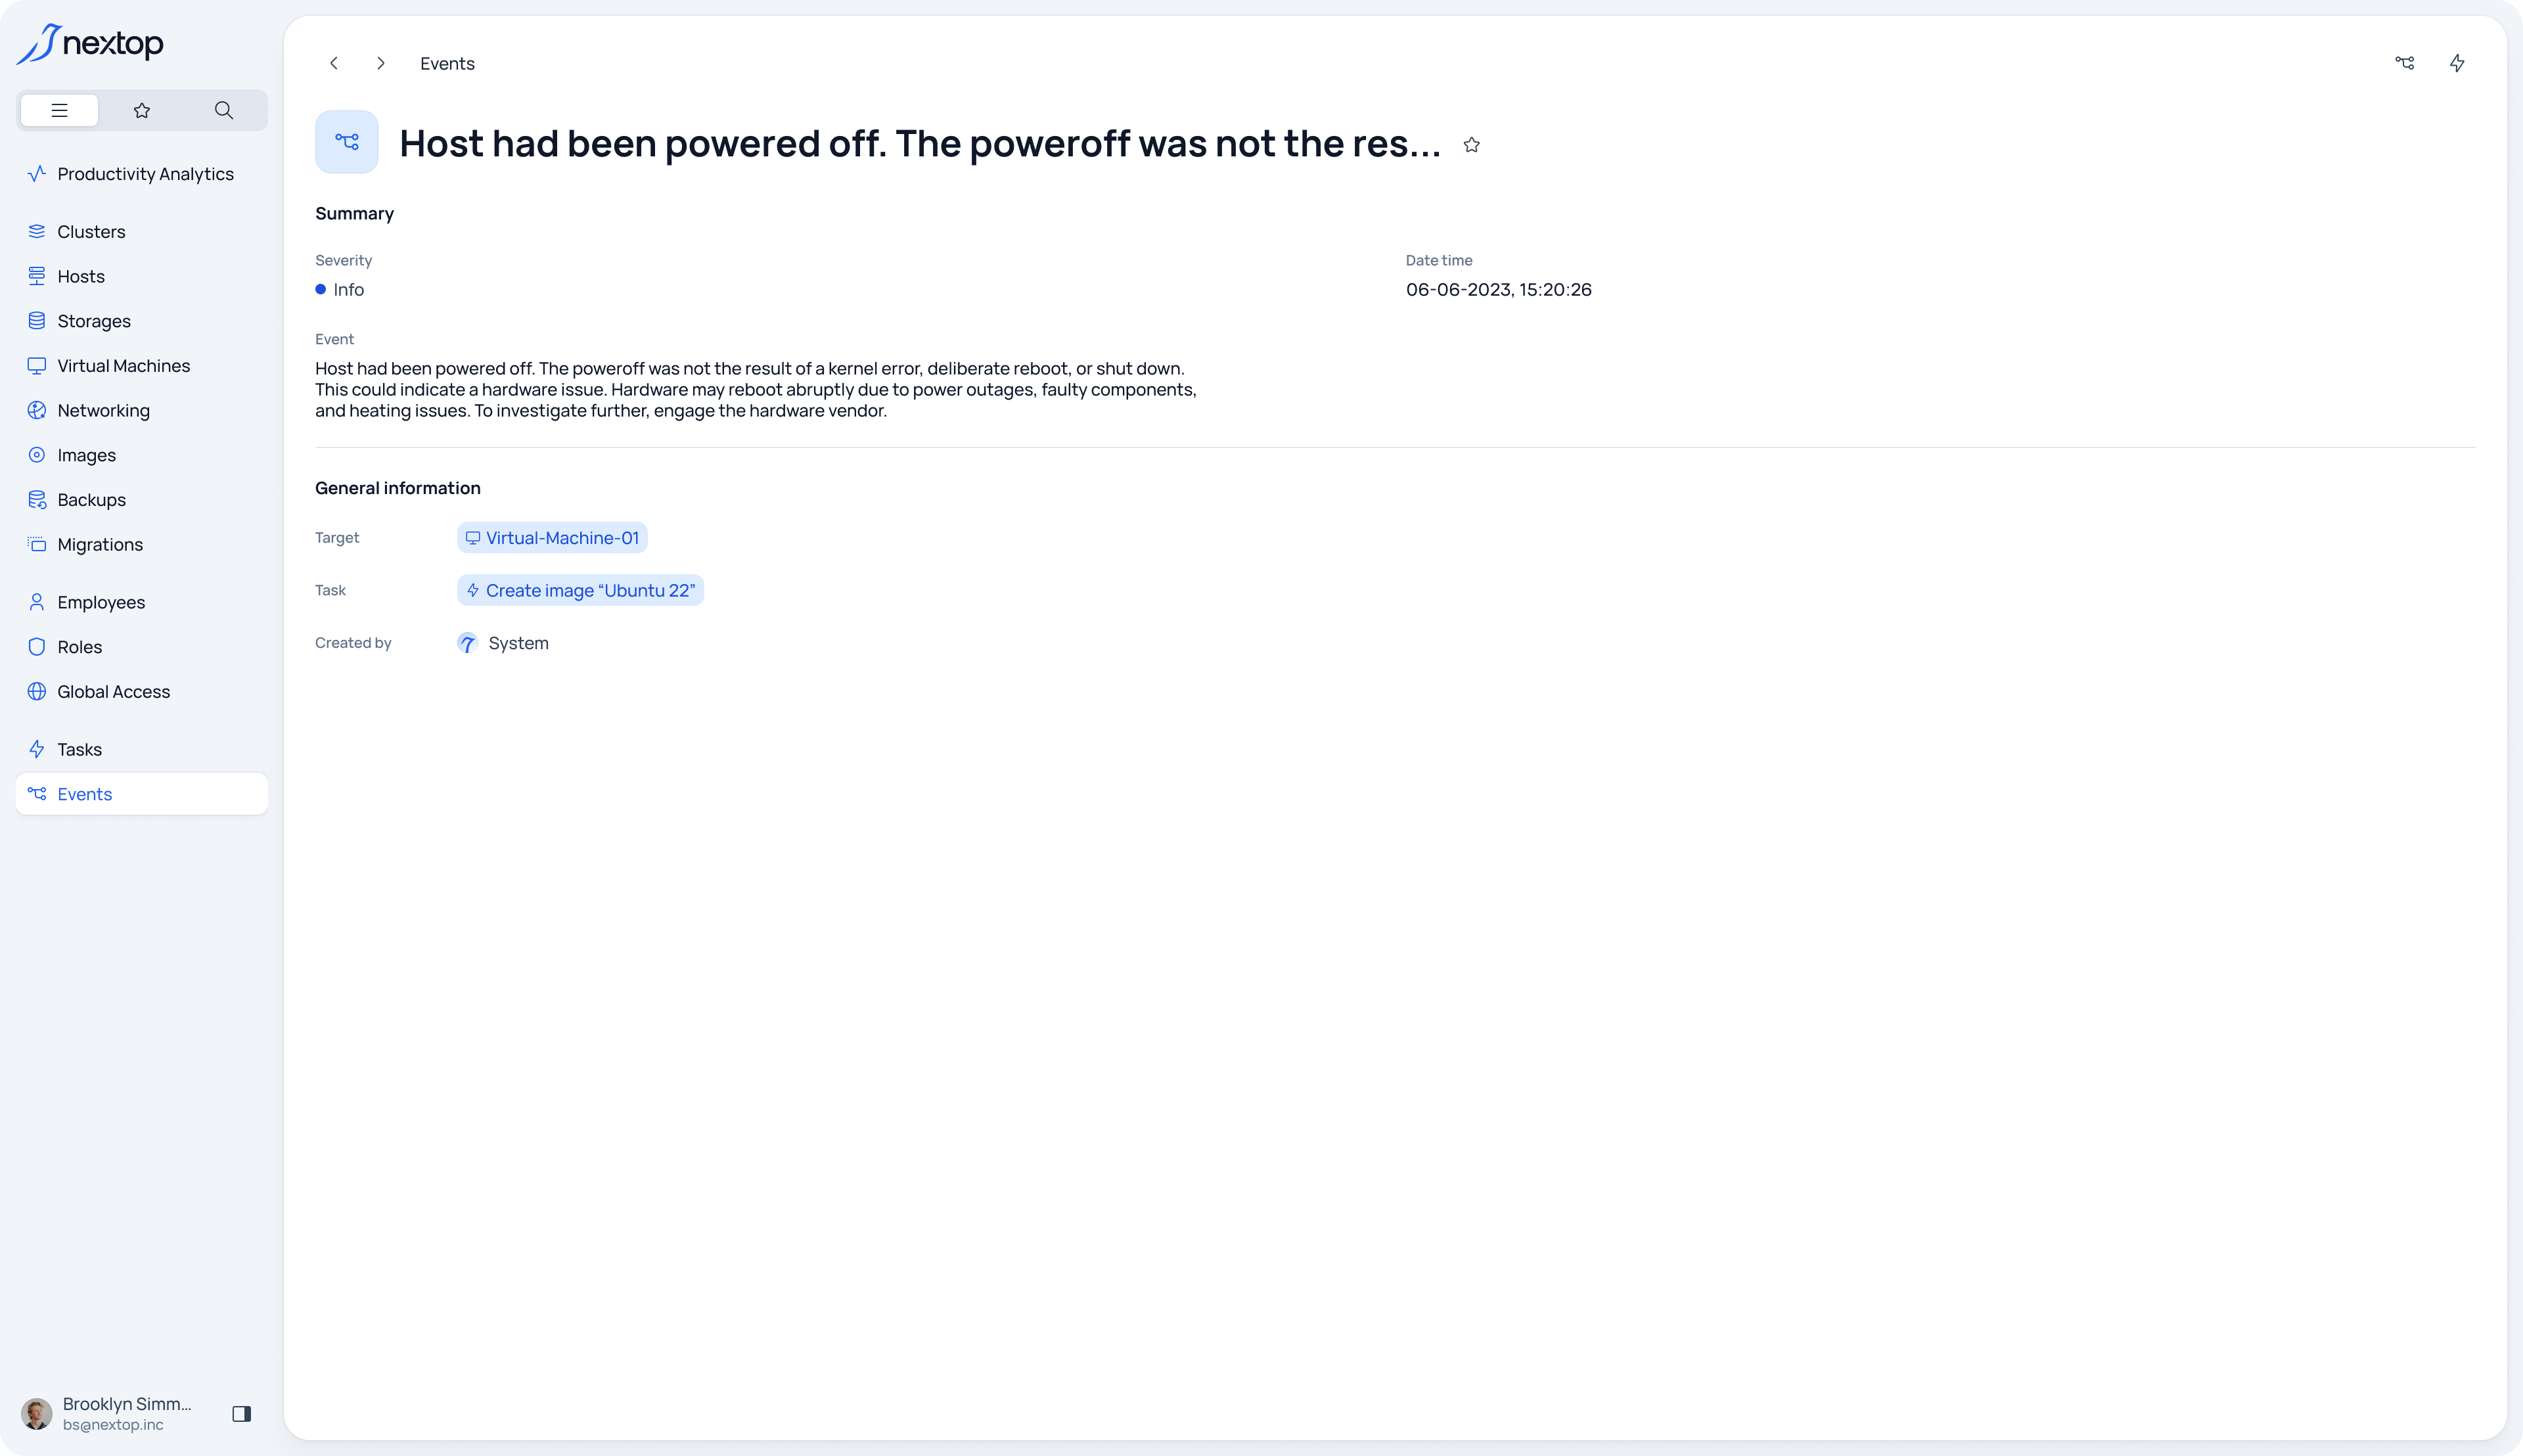
Event type
Date of creation
Event description
Target
Parent task
Creator